As Colorado marks its 149th birthday Friday — and the nation nears its 250th — Susan Schulten steps into the role of State Historian. A longtime professor at the University of Denver and author of “A History of America in 100 Maps,” Schulten explores how cartography reflects power, persuasion and erasure.
She spoke with Colorado Matters host Ryan Warner about why history isn’t about heroes and villains — and why messy stories matter.
This interview has been edited for length and clarity.
Ryan Warner: Why don't you walk us through a historical map that changed how you think about the past?
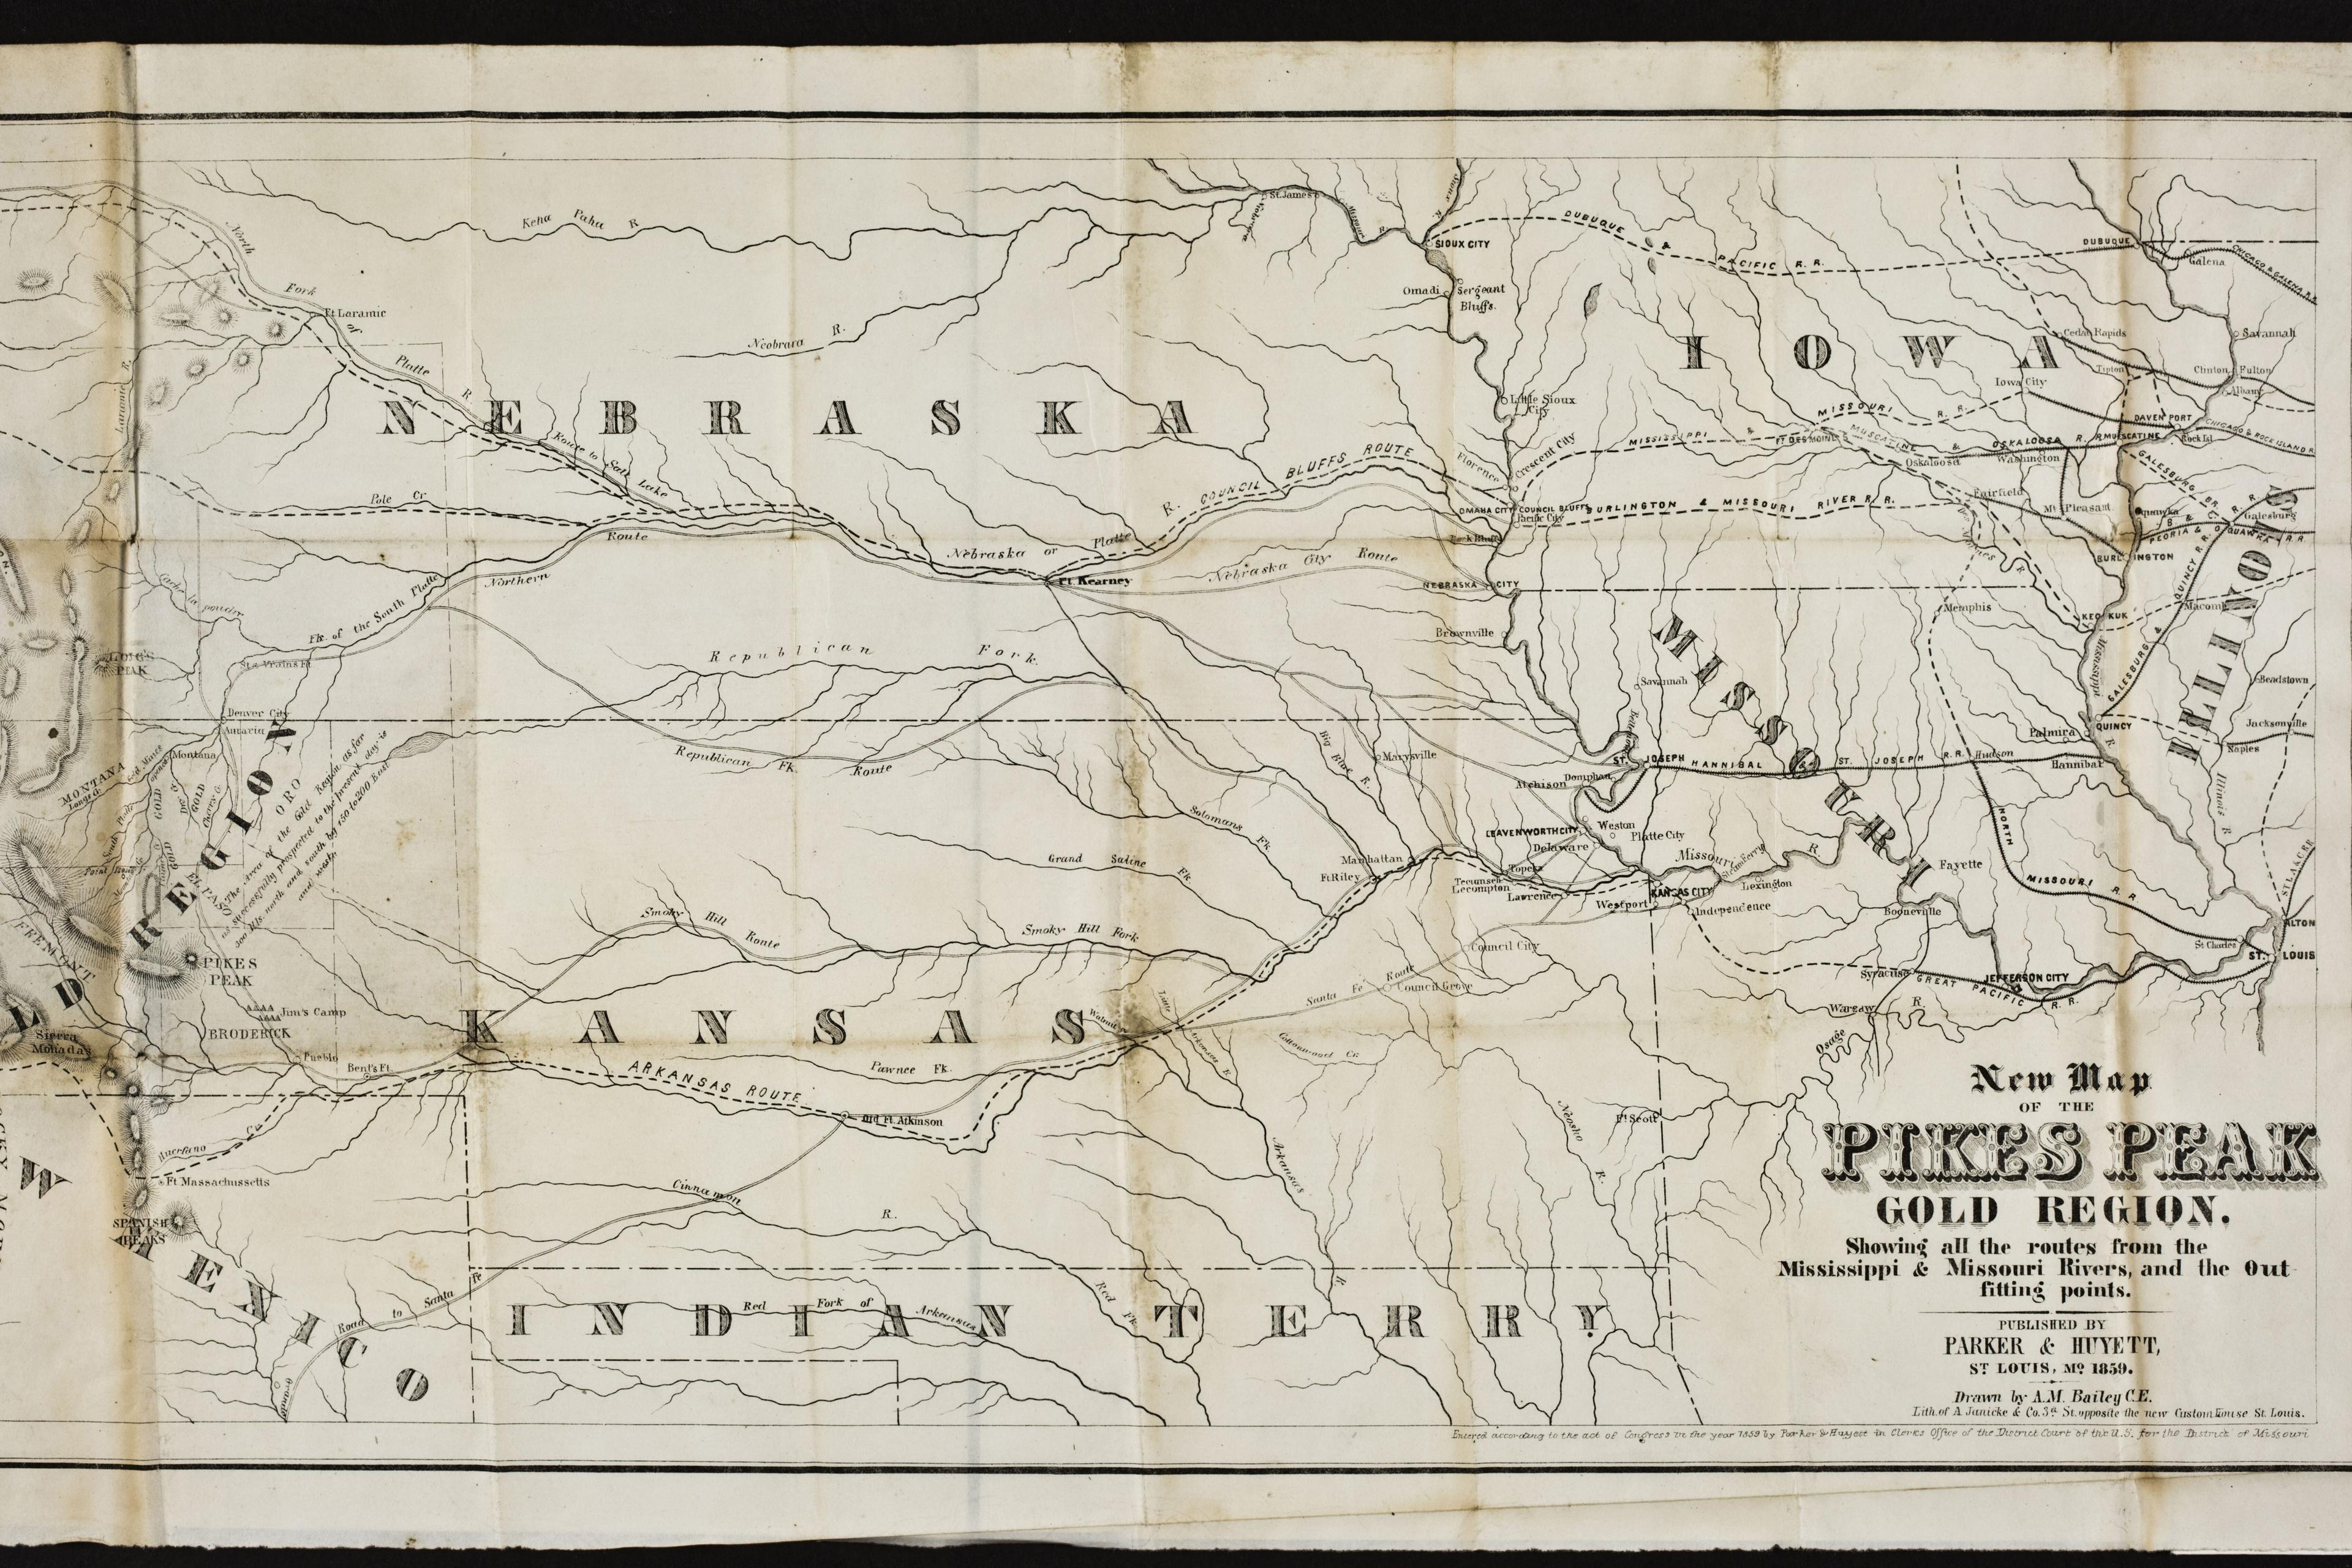
Susan Schulten: There was one that was introduced to me years ago by Wes Brown, a wonderful map collector here in Denver ... one of the few surviving maps from the Pikes Peak Gold Rush. They knew so little about the geography that they named it after one of the few landmarks they knew — Pikes Peak — even though the gold was actually around Denver.
The map was promoting St. Louis as a jumping-off place to the gold fields, and it made it look like it was just a hop, skip, and a jump up a river. It gave the impression of a well-watered plain and shortened the vast stretch across Kansas. It made it look like you couldn’t help but strike it rich.
Warner: Was that map just a misunderstanding or was it meant to deceive people?
Schulten: I think you’re seeing promotion and propaganda. Places were drawing people to outfit themselves in St. Louis or Cincinnati, and each city made it look like their route was the best. It was all about aspiration.
Warner: And in those maps, Indigenous people were virtually erased?
Schulten: Oh, it's really remarkable because in the earlier 19th century, American-made maps of what we understand to be North America and the future extent of the United States — they liberally acknowledge the tribes. The tribes are robust allies, threats, they're all kinds of things, but they're not erased. But over time, as the interior becomes something not just to cross, but something to pay closer attention to in and of itself, you gradually do see an erasure and in this case an erasure of the Arapaho and the Cheyenne.
Warner: I think of the map as always for the user of the map, but the map might be as much for the creator of the map, and I liken that to the sorts of little fold-up maps I might get when I visit a hotel. I mean, there are businesses that have paid to be put on it. That seems like a modern-day equivalent.
Schulten: I think that's right, and there's a wonderful explosion of a certain kind of map in the post-Civil War period, kind of a bird's-eye view of cities in the West. Denver has a beautiful one that hangs in my office, but also the Midwest. And exactly to your point, what we're doing is promoting these places, and so around the edge, you have businesses getting little vignettes of their storefronts, if you will, but the map is really about drawing capital to these places for development.
Warner: Talk about the backdrop of the creation of the Colorado Territory.
Schulten: The gold rush brought this huge migration of unmarried young men — not always the most stable population. And folks in eastern Kansas saw that as a liability.
When Kansas defined its borders, it orphaned the far western edge, including Denver. Congress tried several times to create Colorado Territory, but it only passed a few days before Lincoln was inaugurated, because enough Southern states had seceded that Northern Republicans had the votes.
So the nation was shrinking and growing at the same time, states leaving the Union, and new territories joining it.
Warner: Your tenure will overlap with Colorado turning 150 and the U.S. turning 250. This confluence is why we're called the Centennial State. Susan, does that feel special?
Schulten: It does. I feel pretty honored, and I think that's why I was invited is that I'm a historian of the United States. I'm deeply interested in Colorado, and part of my goal is to place Colorado into that larger story, whether it's regional, national, or beyond.
Warner: Are all maps Eurocentric, or are there other traditions of cartography?
Schulten: That’s a fair question — and you’re actually getting at something deep, which is forms of knowledge.
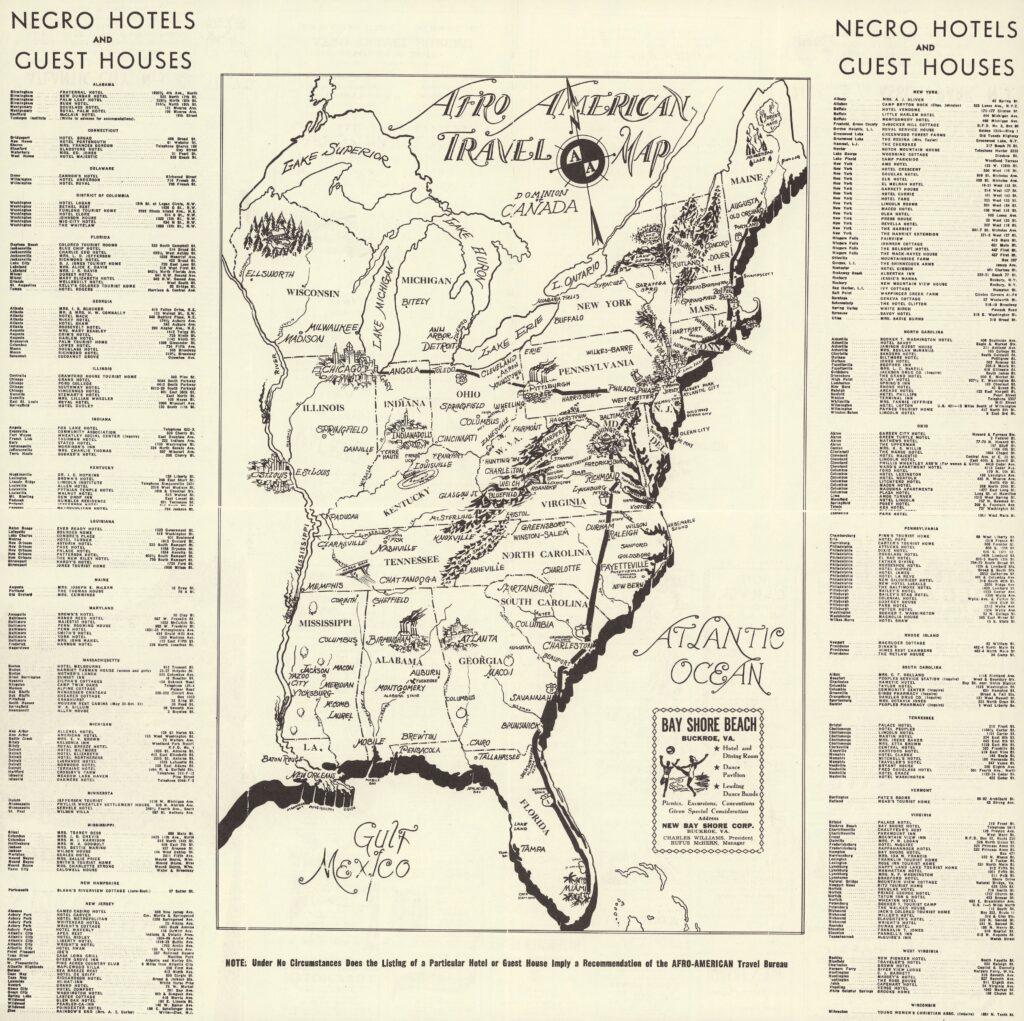
European-American maps were dominant because they were printed, published, and archived. But I came across one map created by African Americans in the 1930s and '40s, showing safe places to stop during car travel in the Jim Crow South. It’s like a predecessor to the Green Book, but visual. A tourist map with a deadly serious purpose.
Warner: You have another example, maybe?
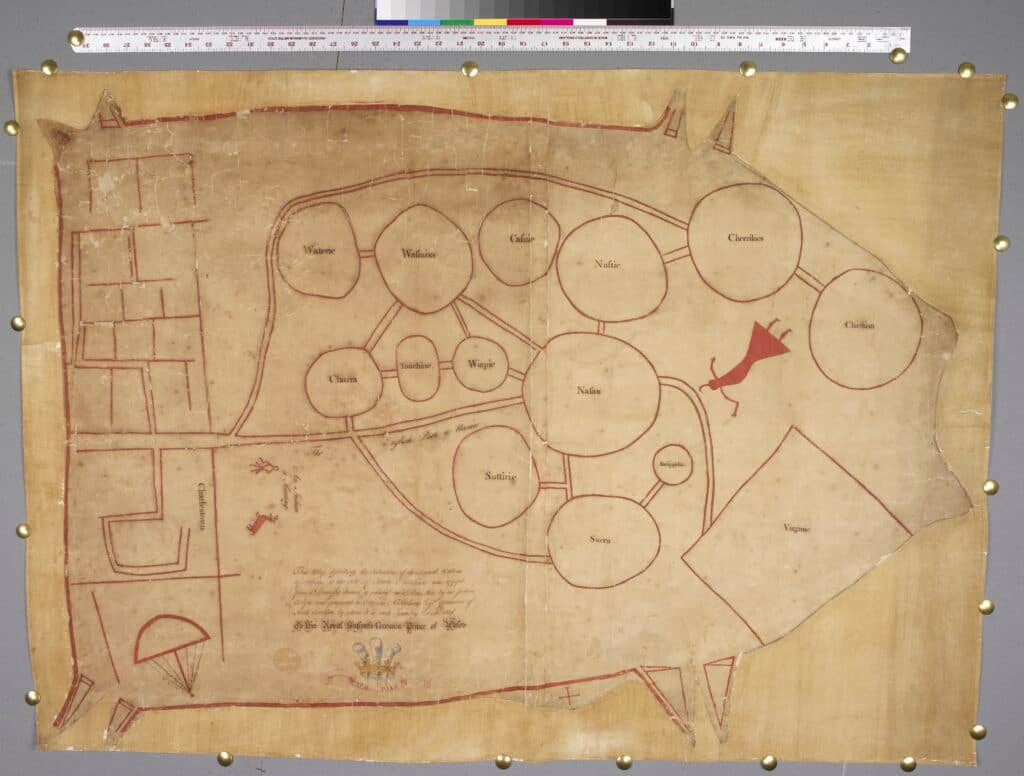
This map really blew me away. It was created about 1720, and we don't know exactly because it was made by Indigenous people. It was made by either the Cherokee or the Catawba in what we now know as the Southeast, the early South Carolina colony. After a terribly deadly war between Indigenous tribes and the South Carolina colonists, one that decimated the deerskin trade, the tribes met with the new governor in Charleston. And they presented him with a deerskin map, with circles on it. It shows varying circles of the different tribes of the Southeast, and it also acknowledges the presence of Virginia and South Carolina colonies.
What it maps is power and relationships. It’s not necessarily Cartesian, like precise geography, but it assesses the varying levels of power, the relationships among tribes, and their diplomatic standing with South Carolina. Some circles are connected to each other, some are not. Some are connected to South Carolina, some are not. It’s a wonderful example of mapping that is still deeply about cartography, but it’s less about absolute space and more about dynamics of power.
Warner: We all have internal maps, how we know a place by heart. Do we lose those maps when people die?
Schulten: That’s really interesting. Home geographies — how people make sense of their world — are like mental maps. There’s a reason that when you’re presented with a map, you look for yourself on it. And the metaphorical maps we carry say a lot about what’s meaningful to us.
Warner: Fill in the blank: If I don’t achieve “blank” by next year, I have fallen short.
Schulten: As much as possible, I want to bring people together in a physical space. Because I think we’re different when we’re together. Hard conversations sometimes get worse online — but they can get better in person.
What I’ve found is that my students really want the more complicated and messy stories — the ones where there are no pure heroes or villains, just people in difficult circumstances making choices.
That’s what I hope to bring to audiences across Colorado.